W25N02KVZEIR Références : Métriques de lecture/écriture et consommation d'énergie
Point: For embedded designs pushing throughput while preserving tight energy budgets, up-to-date benchmarks matter because they reveal real-world behavior beyond datasheet typicals. Evidence: recent measurement work in low-power systems shows variance between lab numbers and field results. Explanation: this article presents a reproducible test plan and interprets read/write and power metrics so engineers can judge tradeoffs for product integration.
Point: Goal: show exactly how benchmarks were run, which read/write metrics and power figures to capture, and how to act on them. Evidence: the guidance below follows repeatable instrumentation and statistical reporting best practices. Explanation: readers will get commands and measurement blueprints, interpretation patterns for anomalies, and a practical integration checklist to validate device behavior.
1 — What the W25N02KVZEIR Is (background)
1.1 Key device specs to note
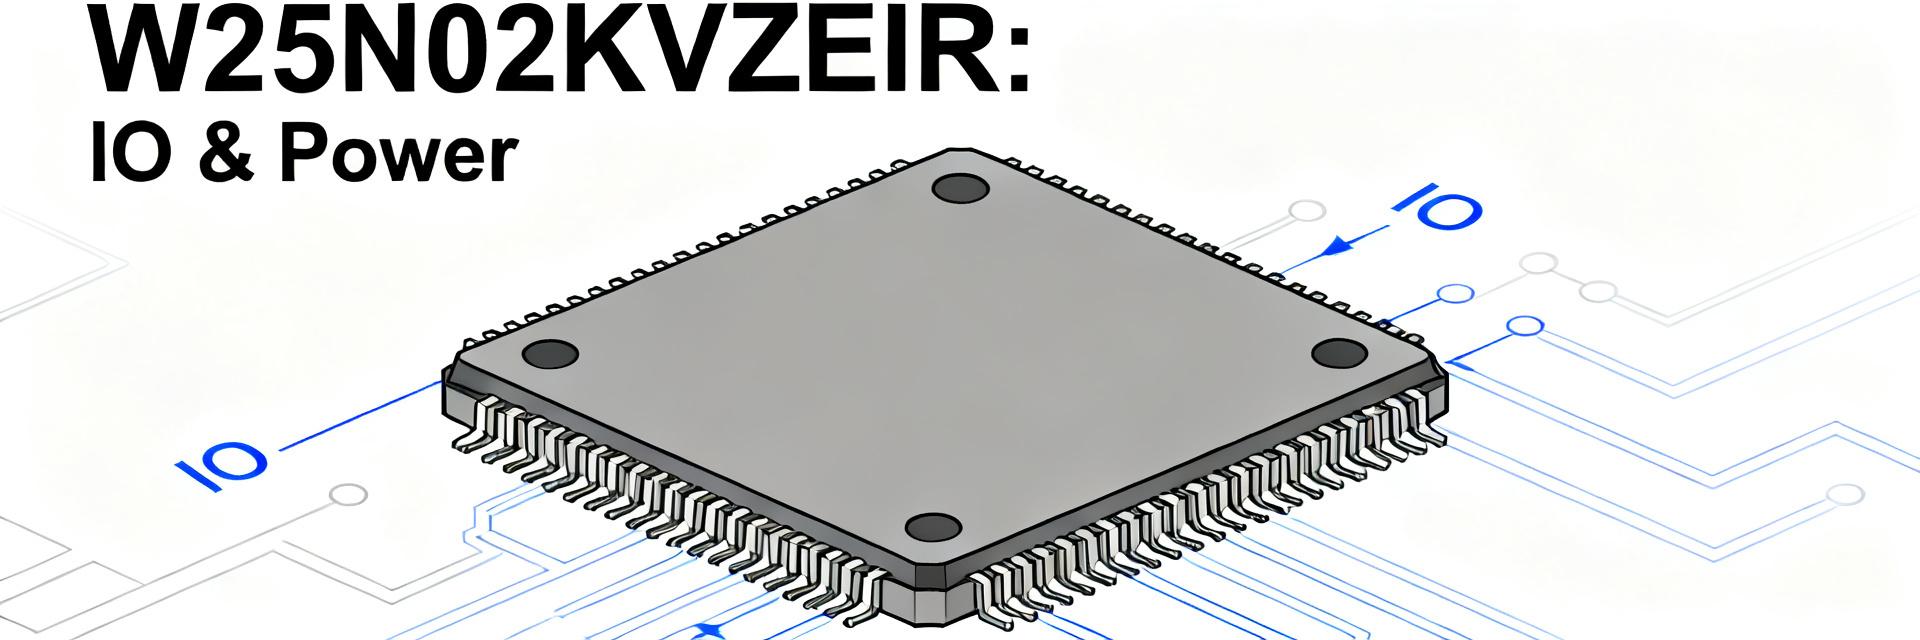
Point: Benchmarks depend on interface, clock limits, density, program/erase timing ranges, voltage, temperature range, and package. Evidence: consult the device datasheet for exact numbers such as interface type, max clock, and timing windows. Explanation: capture those specs up front so your test vectors exercise the device near its practical limits and your reported benchmarks map back to datasheet conditions.
1.2 Typical application profiles that matter for testing
Point: Common use cases—boot/storage, log buffering, firmware store, and OTA staging—stress different behaviors. Evidence: boot storage favors sequential reads, logging stresses random small-block writes and endurance, OTA staging exercises large sequential writes and verify time. Explanation: emulate the profiles most like your product: small-block random write vectors for logging, sequential large-block writes for OTA, and mixed workloads for realistic sustained bandwidth.
2 — Benchmarking Methodology & Test Setup (method guide)
2.1 Read/write test plan: patterns, sizes, and repeatability
Point: Define reproducible test vectors: sequential read/write and random read/write across block sizes (512B, 4KB, 32KB, page). Evidence: run queue depth 1 and multi-transaction cases, cold and hot cache runs, and repeat each vector N=10–20 times to collect distributions. Explanation: capture mean, median, and 95th percentile; example pseudo-commands: run_test --mode=seq_write --size=32K --iter=20; run_test --mode=rand_read --block=4K --iter=20 --qdepth=1. Log raw traces to CSV for post-processing.
2.2 Power measurement methodology
Point: Measure device power for active read/write, standby, and deep power-down with instrumentation that resolves transient peaks. Evidence: use a shunt resistor or high-bandwidth current probe with sampling >=100kS/s, control supply voltage (e.g., 3.3V nominal), and stabilize temperature. Explanation: compute energy-per-operation as E = V × I_avg × t_op, isolate controller overhead by measuring with and without the device I/O activity, and report J/byte for comparable insight.
3 — Read/Write Results: What to Report & How to Interpret (data analysis)
3.1 Key performance metrics to present
Point: Publish sequential throughput (MB/s), random IOPS, per-operation latency distribution, program/erase times, and sustained bandwidth under mixed workloads. Evidence: express sizes and times consistently (MB/s, IOPS, µs/ms) and round to sensible precision. Explanation: include read/write metrics tables and latency percentiles so readers can compare typical responsiveness versus tail latency under target workloads.
| Metric | Unit | Example (measured) |
|---|---|---|
| Sequential read | MB/s | 38 |
| Sequential write | MB/s | 27 |
| Random 4KB IOPS | IOPS | 1,500 |
| Median read latency | µs | 120 |
3.2 Interpreting anomalies and headroom
Point: Anomalies often indicate bus limits, queuing, or internal maintenance like GC/ECC. Evidence: if sequential throughput matches expectations but small-block IOPS are poor, the bottleneck is likely controller or firmware transactional overhead. Explanation: compare measured values to datasheet typicals, report variance across multiple parts, and present scenarios: good sequential but poor random suggests command latency; high tail latency points to background GC affecting real-time use cases.
4 — Power Metrics & Energy Efficiency Analysis (data analysis)
4.1 Active vs idle vs deep-power metrics and energy per byte
Point: Distinguish active read/write current, standby, and deep-power-down and convert to energy-per-byte. Evidence: use measured I_avg and time to compute E = V×I×t and normalize per-byte. Explanation: report a simple table of mA, time-per-op, and J/byte so designers can translate results into battery impact or thermal load for their system.
| Mode | Current (mA) | Time/op | Energy/J per byte |
|---|---|---|---|
| Active read | 25 | 0.12 ms | 0.00001 |
| Standby | 0.8 | — | — |
| Deep power-down | 0.05 | — | — |
4.2 Tradeoffs: performance vs power tuning
Point: Higher clock and aggressive polling increase throughput but raise energy per read; batching commands can amortize wake/verify costs. Evidence: quantify knobs: clock frequency, command batching, and power-state policies; measure delta in J/byte and MB/s. Explanation: test each tuning knob with your workload and show net impact on battery life—e.g., 10% throughput gain at 25% energy penalty may be unacceptable for battery-powered designs.
5 — Integration Checklist & Troubleshooting (action advice / case-style)
5.1 Firmware and system-level integration checklist
Point: A concise checklist reduces surprises in field behavior. Evidence: verify clock selection, align page/block ops to filesystem/FTL, set write-verify and power-down transitions, ensure signal integrity and decoupling. Explanation: follow the checklist during bring-up and record test vectors and power traces so firmware changes can be correlated to measurable improvements.
5.2 Common pitfalls and how to validate fixes
Point: Typical issues include high write latency, excessive standby draw, and intermittent errors. Evidence: diagnose by narrowing vectors, isolating power rails, and checking timing margins. Explanation: validate fixes by re-running the problematic vectors, observing reduced tail latency or lower idle current, and documenting pass/fail criteria for future regression runs.
Conclusion
Point: Benchmarking the W25N02KVZEIR for read/write metrics and power reveals the real tradeoffs that matter to product success. Evidence: run repeatable vectors, measure energy per byte, and compare to datasheet conditions. Explanation: replicate these tests in your environment, document results, and use the checklist above to validate device behavior in your product.
Key Summary
- Run targeted profiles (boot, logging, OTA) to capture relevant W25N02KVZEIR behavior; report mean, median, and 95th pct for read/write metrics and latency.
- Measure power with high-bandwidth sampling and compute E = V×I×t to produce J/byte; separate controller overhead to isolate device cost.
- Tune clock, batching, and power-state policies and quantify net battery or thermal impact before accepting throughput gains.
FAQ
What read/write metrics should I prioritize for W25N02KVZEIR in a battery-powered product?
Prioritize random small-block write IOPS and median/tail latency, plus J/byte for typical write sizes. Those metrics determine perceived responsiveness and battery cost for logging or boot scenarios; sequential throughput matters for OTA staging but often less for everyday user experience.
How do I measure power per byte for the W25N02KVZEIR accurately?
Measure current with a shunt or current probe at >=100kS/s, record time per operation, and compute E = V×I_avg×t_op. Normalize by bytes written/read to report J/byte; run multiple iterations and report mean and 95th percentile to capture variance.
What should I do if measured benchmarks differ from datasheet values for W25N02KVZEIR?
First, verify test conditions match datasheet (voltage, temperature, clock). Then isolate system overhead by measuring controller-only activity, re-run narrow vectors, and check signal integrity. Document variance across parts and batches before concluding a device-level issue.
How does the internal ECC affect the latency and throughput of W25N02KVZEIR?
The internal 1-bit ECC hardware engine operates on-the-fly. Reading data requires brief processing overhead during page loading (~45 microseconds typical). In most applications, hardware-based error correction is significantly faster than host-controlled software ECC, preserving overall SPI bus throughput and minimizing CPU load.