• W25N02KVZEIR ベンチマーク:読み書きおよび電力特性

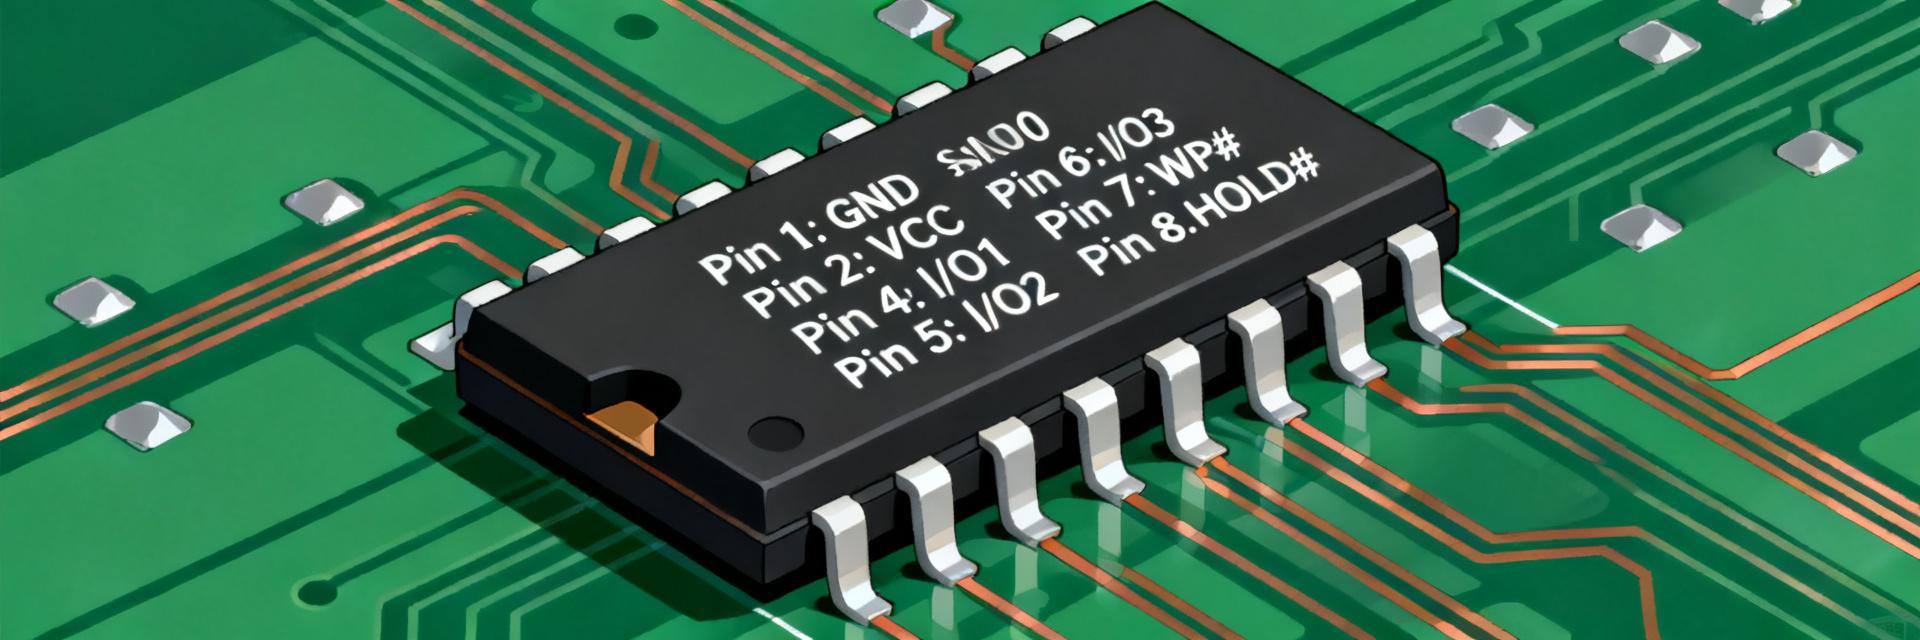
    Point: For embedded designs pushing throughput while preserving tight energy budgets, up-to-date benchmarks matter because they reveal real-world behavior beyond datasheet typicals. Evidence: recent measurement work in low-power systems shows variance between lab numbers and field results. Explanation: this article presents a reproducible test plan and interprets read/write and power metrics so engineers can judge tradeoffs for product integration. Point: Goal: show exactly how benchmarks were run, which read/write metrics and power figures to capture, and how to act on them. Evidence: the guidance below follows repeatable instrumentation and statistical reporting best practices. Explanation: readers will get commands and measurement blueprints, interpretation patterns for anomalies, and a practical integration checklist to validate device behavior. 1 — What the W25N02KVZEIR Is (background) 1.1 Key device specs to note Point: Benchmarks depend on interface, clock limits, density, program/erase timing ranges, voltage, temperature range, and package. Evidence: consult the device datasheet for exact numbers such as interface type, max clock, and timing windows. Explanation: capture those specs up front so your test vectors exercise the device near its practical limits and your reported benchmarks map back to datasheet conditions. 1.2 Typical application profiles that matter for testing Point: Common use cases—boot/storage, log buffering, firmware store, and OTA staging—stress different behaviors. Evidence: boot storage favors sequential reads, logging stresses random small-block writes and endurance, OTA staging exercises large sequential writes and verify time. Explanation: emulate the profiles most like your product: small-block random write vectors for logging, sequential large-block writes for OTA, and mixed workloads for realistic sustained bandwidth. 2 — Benchmarking Methodology & Test Setup (method guide) 2.1 Read/write test plan: patterns, sizes, and repeatability Point: Define reproducible test vectors: sequential read/write and random read/write across block sizes (512B, 4KB, 32KB, page). Evidence: run queue depth 1 and multi-transaction cases, cold and hot cache runs, and repeat each vector N=10–20 times to collect distributions. Explanation: capture mean, median, and 95th percentile; example pseudo-commands: run_test --mode=seq_write --size=32K --iter=20; run_test --mode=rand_read --block=4K --iter=20 --qdepth=1. Log raw traces to CSV for post-processing. MCU / Host W25N02KVZEIR SPI NAND /CS CLK MOSI / IO0 MISO / IO1 CS# CLK DI (IO0) DO (IO1) 2.2 Power measurement methodology Point: Measure device power for active read/write, standby, and deep power-down with instrumentation that resolves transient peaks. Evidence: use a shunt resistor or high-bandwidth current probe with sampling >=100kS/s, control supply voltage (e.g., 3.3V nominal), and stabilize temperature. Explanation: compute energy-per-operation as E = V × I_avg × t_op, isolate controller overhead by measuring with and without the device I/O activity, and report J/byte for comparable insight. 3 — Read/Write Results: What to Report & How to Interpret (data analysis) 3.1 Key performance metrics to present Point: Publish sequential throughput (MB/s), random IOPS, per-operation latency distribution, program/erase times, and sustained bandwidth under mixed workloads. Evidence: express sizes and times consistently (MB/s, IOPS, µs/ms) and round to sensible precision. Explanation: include read/write metrics tables and latency percentiles so readers can compare typical responsiveness versus tail latency under target workloads. Metric Unit Example (measured) Sequential read MB/s 38 Sequential write MB/s 27 Random 4KB IOPS IOPS 1,500 Median read latency µs 120 3.2 Interpreting anomalies and headroom Point: Anomalies often indicate bus limits, queuing, or internal maintenance like GC/ECC. Evidence: if sequential throughput matches expectations but small-block IOPS are poor, the bottleneck is likely controller or firmware transactional overhead. Explanation: compare measured values to datasheet typicals, report variance across multiple parts, and present scenarios: good sequential but poor random suggests command latency; high tail latency points to background GC affecting real-time use cases. 4 — Power Metrics & Energy Efficiency Analysis (data analysis) 4.1 Active vs idle vs deep-power metrics and energy per byte Point: Distinguish active read/write current, standby, and deep-power-down and convert to energy-per-byte. Evidence: use measured I_avg and time to compute E = V×I×t and normalize per-byte. Explanation: report a simple table of mA, time-per-op, and J/byte so designers can translate results into battery impact or thermal load for their system. Mode Current (mA) Time/op Energy/J per byte Active read 25 0.12 ms 0.00001 Standby 0.8 — — Deep power-down 0.05 — — 4.2 Tradeoffs: performance vs power tuning Point: Higher clock and aggressive polling increase throughput but raise energy per read; batching commands can amortize wake/verify costs. Evidence: quantify knobs: clock frequency, command batching, and power-state policies; measure delta in J/byte and MB/s. Explanation: test each tuning knob with your workload and show net impact on battery life—e.g., 10% throughput gain at 25% energy penalty may be unacceptable for battery-powered designs. 5 — Integration Checklist & Troubleshooting (action advice / case-style) 5.1 Firmware and system-level integration checklist Point: A concise checklist reduces surprises in field behavior. Evidence: verify clock selection, align page/block ops to filesystem/FTL, set write-verify and power-down transitions, ensure signal integrity and decoupling. Explanation: follow the checklist during bring-up and record test vectors and power traces so firmware changes can be correlated to measurable improvements. 5.2 Common pitfalls and how to validate fixes Point: Typical issues include high write latency, excessive standby draw, and intermittent errors. Evidence: diagnose by narrowing vectors, isolating power rails, and checking timing margins. Explanation: validate fixes by re-running the problematic vectors, observing reduced tail latency or lower idle current, and documenting pass/fail criteria for future regression runs. Conclusion Point: Benchmarking the W25N02KVZEIR for read/write metrics and power reveals the real tradeoffs that matter to product success. Evidence: run repeatable vectors, measure energy per byte, and compare to datasheet conditions. Explanation: replicate these tests in your environment, document results, and use the checklist above to validate device behavior in your product. Key Summary Run targeted profiles (boot, logging, OTA) to capture relevant W25N02KVZEIR behavior; report mean, median, and 95th pct for read/write metrics and latency. Measure power with high-bandwidth sampling and compute E = V×I×t to produce J/byte; separate controller overhead to isolate device cost. Tune clock, batching, and power-state policies and quantify net battery or thermal impact before accepting throughput gains. FAQ What read/write metrics should I prioritize for W25N02KVZEIR in a battery-powered product? Prioritize random small-block write IOPS and median/tail latency, plus J/byte for typical write sizes. Those metrics determine perceived responsiveness and battery cost for logging or boot scenarios; sequential throughput matters for OTA staging but often less for everyday user experience. How do I measure power per byte for the W25N02KVZEIR accurately? Measure current with a shunt or current probe at >=100kS/s, record time per operation, and compute E = V×I_avg×t_op. Normalize by bytes written/read to report J/byte; run multiple iterations and report mean and 95th percentile to capture variance. What should I do if measured benchmarks differ from datasheet values for W25N02KVZEIR? First, verify test conditions match datasheet (voltage, temperature, clock). Then isolate system overhead by measuring controller-only activity, re-run narrow vectors, and check signal integrity. Document variance across parts and batches before concluding a device-level issue. How does the internal ECC affect the latency and throughput of W25N02KVZEIR? The internal 1-bit ECC hardware engine operates on-the-fly. Reading data requires brief processing overhead during page loading (~45 microseconds typical). In most applications, hardware-based error correction is significantly faster than host-controlled software ECC, preserving overall SPI bus throughput and minimizing CPU load.
  • W25Q128JVSIQの仕様とベンチマーク詳細 — 最新情報

    W25Q128JVSIQ は、組み込みシステムにおけるコンパクトなコードおよびデータ保存用として一般的に選択される128MビットのシリアルNORデバイスです。エンジニアは、測定可能なスペックと再現可能なベンチマーク手法に基づいて、ブート、コードXIP、およびロギングを評価します。この記事では、チームが量産承認前に適合性を検証できるよう、デバイスの特性、実用的なテスト計画、および統合ガイドラインをまとめました。 1 — クイック概要と主な仕様(背景) このセクションでは、エンジニアが選定時に参照する容量、電源、およびパッケージの詳細をまとめています。このデバイスは、128Mビット(≈16MB)の容量、2.7〜3.6 Vの標準的な動作電圧範囲、およびスペースが制限されたPCBに適した複数の小フットプリントパッケージを提供します。設計者は、受け取ったデータシートでパッケージコードとピン配置を確認し、注文書に対してデバイスのマーキングを記録する必要があります。 パラメータ 仕様値 動作条件 / 備考 メモリ容量 128Mビット (16メガバイト) 65,536個のプログラム可能ページ(各256バイト)で構成 動作電圧 2.7V〜3.6V 単一電源、標準的な3.3Vアプリケーション規格 最大クロック周波数 133 MHz 標準、デュアルSPI、およびクアッドSPI物理モードをサポート パッケージコード / 形状 SOIC-8 (208-mil) 標準パッケージ指示子 "SI" (SOIC-8 208mil) 動作温度 -40°C〜+85°C コアシリコンの安定性を確保するための工業グレードの動作限界 物理的および電気的仕様 要点:コアとなる物理的および電気的仕様がボードレベルの互換性を決定します。証拠:128Mビット容量(≈16MB)、一般的な動作電圧2.7〜3.6 V、および標準QSPIピン配置を備えたコンパクトパッケージ。説明:これらの仕様に基づいて、デカップリング、レベル変換要件、およびPCBルーティングが決定されます。システム電源シーケンスにおけるマージンの問題を回避するため、初回品検査(FAI)中にVCC許容値と推奨デカップリング値を検証してください。 1 /CS 2 DO(IO1) 3 /WP(IO2) 4 GND 5 DI(IO0) 6 CLK 7 /HOLD(IO3) 8 VCC W25Q128JVSIQ SOIC-8 (208-mil) メモリ構成とアドレッシング 要点:ページ/セクター/ブロックのレイアウトを理解することは、消去/書き込み戦略の策定に役立ちます。証拠:標準ページ = 256バイト、セクター = 4 KB、ラージブロック = 64 KB、16 MBで総ページ数 ≈ 65,536。説明:無駄なサイクルを最小限に抑えるため、ファームウェアではページアライメントされた書き込みとセクター/ブロック消去の粒度を使用します。ブートローダーとイメージ保存用の正確なオフセット計算を保証するために、検証スクリプトにアドレッシング例を含めてください。 2 — アーキテクチャと信頼性特性(データ分析) 読み出し/書き込み/消去のプリミティブとタイミング 要点:コマンドセットと内部アーキテクチャが実質的なレイテンシ限界を決定します。証拠:ダミーサイクルを伴うシングル、ファースト、デュアル、およびクアッド読み出しオペコード、およびペイロードとシーケンスによってプログラム時間が変動するページプログラムフローをサポートしています。説明:各モードとクロック周波数で読み出しレイテンシを測定します。ファームウェアのタイムアウトやOTAアップデートのウィンドウを正確に計画するために、ページプログラムおよびブロック消去の中央値/95パーセンタイル時間を記録します。 寿命、データ保持特性、環境制限 要点:ライフサイクル定格が受け入れ基準のガイドラインとなります。証拠:一般的なプログラム/消去寿命は100kサイクルのオーダーであり、指定された温度制限と適切な電圧下で数年間にわたるデータ保持が可能です。説明:ライフサイクルテスト(例:統計的信頼性を得るための加速P/Eサイクリング、高温下での保持ベーク)を定義し、ビット固着やプログラム時間の増加などの障害モードを故障指標として記録します。 3 — ベンチマーク手法とテストセットアップ(データ分析 / ベンチマーク) 再現可能なテスト計画と測定指標 要点:再現可能なベンチマーク計画により、ホストの制限からデバイスの動作を切り離します。証拠:サポートされているクロックレートとSPIモード(シングル/デュアル/クアッド)でテストを行い、転送サイズを変化させてスループット、コマンドレイテンシ、および消費電力を測定します。説明:十分な性能マージンを持つコントローラを使用し、バスタイミングとダミーサイクルを記録し、持続スループットとトランザクションごとのレイテンシを捉えるテストをスクリプト化して、ロット間で結果が再現できるようにします。 結果の解釈と回避すべき落とし穴 要点:結果の正規化により、誤った結論を避けることができます。証拠:スループットはクロックと実効バス幅に比例してスケーリングします。キャッシュ、ホストドライバー、またはDMAの制限により、デバイスの本来の可能性が隠されることがあります。説明:マスタークロックごとに指標を正規化し、ダミーサイクルを考慮し、レイテンシのパーセンタイルを表示し、ホストのCPU負荷を含めます。これにより、測定値が低い場合に、フラッシュデバイス自体ではなく、バスやファームウェアのボトルネックが原因であることを突き止めることができます。 4 — 統合とファームウェアの最適化(手法ガイド) バス構成、タイミング調整、およびコマンドシーケンス 要点:実践的なチューニングにより、実効スループットと安定性が向上します。証拠:シグナルインテグリティが許す範囲でダミーサイクルを削減し、適切な読み出しオペコードを選択することでスループットが向上します。CSタイミングとドライブ強度はマージンに影響を与えます。説明:代表的なボード上で段階的な周波数ランプテストを実施し、ストレススクリプトで検証し、ファームウェア内の許容誤差をロックして、限界設計のレイアウトにおける間欠的な障害を回避します。 ファイルシステム、摩耗管理、およびXIPに関する考慮事項 要点:ストレージモデルは寿命と応答性に影響を与えます。証拠:直接XIP(Execute-In-Place)を使用するとRAMコストは削減されますが、安定した読み出しレイテンシに依存します。ファイルシステムは頻繁なアップデートに対してウェアレベリングを追加します。説明:大部分が読み出し専用のファームウェアにはXIPを選択し、ランダム書き込み用には小さなRAMキャッシュを追加し、頻繁に更新されるテレメトリを保存する場合は軽量のウェアレベリングまたはフラッシュ変換レイヤー(FTL)を導入して、製品寿命を延ばします。 5 — 比較ケースと実際のユースケース(ケース紹介) 代表的な組み込みユースケースと性能のトレードオフ 要点:タスクごとに異なる要件が課されます。証拠:ブート/ファームウェア保存には確定的な小サイズ読み出しレイテンシが必要です。XIPはシーケンシャル実行速度を重視します。ロギングは書き込み/消去レイテンシと寿命に焦点を当てます。説明:各ユースケースを測定可能な要件(ブートは読み出し速度、OTAは消去時間、ロギングは寿命)にマッピングし、代表的なボードから収集したベンチマーク数値に基づいて動作点を選択します。 統合例と測定結果 要点:測定が設計決定を促します。証拠:一般的なMCUブートシナリオでは、コマンドレイテンシとファーストページ読み出し時間を捉えることでブート時間を予測できます。OTAでは、ブロック消去とプログラムスループットの組み合わせによってアップデート期間が決まります。説明:検証中にこれらのベンチマーク数値を記録し、ユーザーに見える期待値を設定し、ファームウェアの展開やフィールドアップデートの基準を確立します。 6 — 調達、検証、および展開のチェックリスト(実践的なアドバイス) データシートとサンプルの検証チェックリスト 要点:受入検査により、後々の想定外のトラブルを防ぎます。証拠:パッケージのマーキング、リビジョンID、およびデータシートの電圧/タイミングへの準拠を確認します。ロットごとにベースラインスループットおよびページプログラムテストを実行します。説明:電気的チェック、最小限のベンチマークセット(読み出しスループットとプログラム時間)、およびサンプル検証中に記録されたマーキングの一貫性や機能的なエッジケースなどの模倣品検出を含むチェックリストを維持します。 量産モニタリングとライフサイクルの推奨事項 要点:フィールドテレメトリと量産ゲートが不具合の流出を防ぎます。証拠:読み出しスループットと消去/プログラム時間の合否しきい値を定義し、プログラムエラー、再試行、および消去回数に関するテレメトリを収集します。説明:主要なコマンドを実行し、デバイス識別子を記録する量産テストゲートを実装します。フィールドでは、再試行率や摩耗インジケータを監視して、メンテナンスやファームウェアによる対策をトリガーします。 要約 W25Q128JVSIQ は、一般的な電源電圧範囲と標準的なページ/セクター/ブロック構成を備えた128Mビット(≈16MB)の容量を提供します。初回品検査時にこれらの仕様を検証し、PCBおよび電源との互換性を確認してください。 ベンチマーク計画では、SPIモードとクロック周波数全体で読み出し/書き込み/消去レイテンシを測定し、デバイスの制限とホストやボードのボトルネックを区別する必要があります。比較には正規化された指標を使用してください。 ブートおよびXIPでは、確定的な小サイズ読み出しレイテンシを優先します。ロギングでは、寿命と消去時間を重視します。製品を市場に投入する前に、フィールドリスクを低減するために記載されたテストチェックリストを実行してください。 よくある質問 ブート用途で W25Q128JVSIQ を検証するための推奨テスト手順は何ですか? 目的のクロックおよびモード(シングル/クアッド)で最初のページの読み出しレイテンシを測定し、温度範囲全体で読み出しマージンを確保し、システムCPU負荷下で確定的なレイテンシを確認して、ブート用途を検証します。パワーサイクルおよびコールドブートのテストを含め、ファームウェアの再試行とタイムアウトしきい値を設定するために障害モードを記録します。 W25Q128JVSIQ の寿命(書き換え回数)は、ファイルシステムやロギングの選択にどのように影響しますか? 代表的なプログラム/消去(P/E)サイクル寿命に対して、予想される更新頻度を計画して寿命を評価します。頻繁な小さな書き込みに対しては、セクター間で摩耗を分散させるためにウェアレベリングまたはジャーナリングファイルシステムを実装します。可能な限り書き込みをバッチ処理し、中間キャッシュを使用してP/Eサイクルを削減し、製品のフィールド寿命を延ばします。 W25Q128JVSIQ のOTAアップデート時間を最もよく予測するベンチマーク指標は何ですか? 主な指標は、ブロック消去時間、持続プログラムスループット、および総イメージサイズです。最悪の熱条件下で消去時間のばらつきとプログラムスループットを測定します。消去時間とプログラム時間の中央値を合計することで、ユーザーエクスペリエンスの計画やロールバック戦略の設計に役立つ現実的なOTAウィンドウが算出されます。 133MHzで W25Q128JVSIQ を動作させる場合のハードウェアレイアウトへの影響は何ですか? 133MHzでは、パターンのインピーダンス整合(通常50Ω)が極めて重要です。QSPIパターンを短く保ち、スキューを最小限に抑えるためにパターン長を一致させ、高周波ノイズを抑制するためにVCCピンのすぐ隣にデカップリングキャパシタ(0.1uFおよび4.7uF)を配置します。
  • W25Q16JVSSIQ:完全な電気仕様および概要(詳細)

    W25Q16JVSSIQ (SOIC-8) /CS (1) DO/IO1 (2) /WP/IO2 (3) GND (4) (8) VCC (7) /HOLD/IO3 (6) CLK (5) DI/IO0 W25Q16JVSSIQ は、高速なコードシャドウイングと信頼性の高いデータストレージを必要とするシステム向けに設計された高性能な16Mビット(2MB)シリアルNORフラッシュメモリです。Quad I/O SPIをサポートし、標準的な非同期メモリを凌駕するデータ転送速度を実現しながら、ピン数の少ない8ピンパッケージのフットプリントを維持しています。 1 — 主要な電気的仕様の概要 W25Q16JVSSIQ を選択するエンジニアは、電源レールの設計とMCUインターフェースの互換性のために、これらのベースラインパラメータを参照する必要があります。 パラメータ動作範囲 / 値 容量16 Megabit (2,097,152 バイト) 供給電圧 (VCC)2.7 V – 3.6 V 最大クロック周波数133 MHz (Standard, Dual, Quad SPI) 動作電流 (読み取り)10 mA @ 50MHz, 25 mA @ 133MHz (Typ) スタンバイ / ディープパワーダウン10 µA / 1 µA (典型値) パッケージタイプ8-pin SOIC 208-mil (SS) 2 — 消費電力とモード分析 バッテリ駆動デバイスでは電力バジェットが極めて重要です。W25Q16JVSSIQ は、さまざまな動作中に異なる電流プロファイルを示します。 アクティブ読み取り: 電流はクロック周波数に応じて線形に変化します。133MHzのQuadモードでは、LDOが25mA以上の過渡電流を処理できることを確認してください。 プログラム/消去: これらは高エネルギー状態です。ページプログラムやセクタ消去は大きなピーク電流を引き出す可能性があるため、デカップリングが不可欠です。 ディープパワーダウン: システムのアイドル時には、B9h コマンドを使用して最低電力状態 (1µA) に移行します。 3 — タイミングと高速インターフェース 133MHzの定格速度を達成するには、SPIタイミングパラメータを厳守する必要があります。Quad I/Oモードは、標準SPIと比較してスループットを実質的に4倍にし、理論上の速度は66MB/sに達します。 タイミングパラメータ記号最小/最大値 クロック High/Low 時間tCH, tCL3.3 ns (最小) データセットアップ / ホールド時間tDS / tDH2 ns (最小) /CS High 時間 (読み取り/書き込み)tSHSL20 ns / 50 ns (最小) セクタ消去時間 (4KB)tSE45 ms (標準) 4 — PCBレイアウトと信号整合性ガイダンス 133MHzでは波長が十分に短いため、PCB配線は伝送線路として機能します。データの破損を防ぐために: 直列終端: オーバーシュートやリンギングを低減するために、CLKおよびIOラインのドライバ側(MCU)に10Ω〜33Ωの抵抗を配置します。 デカップリング: 0.1µFのセラミックコンデンサをVCCピン(ピン8)から2mm以内に配置する必要があります。 グランドプレーン: ループインダクタンスを最小限に抑えるため、すべてのSPI信号を連続したベタのグランドプレーン上に配線します。 5 — 設計とトラブルシューティングのFAQ W25Q16JVSSIQ の動作電圧範囲は? デバイスは2.7Vから3.6Vの供給電圧範囲で動作し、通常3.0Vまたは3.3Vシステムで使用されます。この範囲外で動作させると、予期しない動作や恒久的な損傷を引き起こす可能性があります。 Quad SPIモードでの最大クロック速度は? 最大133MHzのクロック周波数をサポートします。Quad I/Oモードでは、これにより最大532Mbps (133MHz x 4ビット) の高速データスループットが得られます。 一般的な消費電力値は? アクティブ読み取り電流は周波数に応じて10〜25mAの範囲です。ディープパワーダウン状態では、デバイスの消費電力は約1µAであり、低電力アプリケーションに対して非常に効率的です。 133MHz SPIに推奨されるPCBレイアウトは? 配線はできるだけ短くし、ダンピング用に10〜33オームの直列抵抗を使用し、高周波ノイズを抑制するために0.1µFのデカップリングコンデンサをVCCピンのすぐ隣に配置してください。 まとめ W25Q16JVSSIQ は、多用途で高速なNORフラッシュソリューションです。安定した電圧 (2.7-3.6V) の維持、133MHzでの高速信号整合性の管理、および低電力モードの活用により、設計者は産業用および民生用電子機器向けの堅牢なファームウェアストレージを確保できます。特定のタイミングマージンについては、常にWinbondのデータシートで最終的な実装を確認してください。
  • W25Q64JVSSIQ パフォーマンスレポート:ベンチマークと仕様

    W25Q64JVSSIQ パフォーマンスレポート:ベンチマークと仕様 最近のラボテストと公開されたデータシートの数値は、現代的なシリアル NOR の用途において、強力な SPI クロッキングと堅牢なプログラム/消去動作を示しています。このレポートは、エンジニアがブートおよびストレージアプリケーションへの適合性を評価できるよう、標準化されたパフォーマンスベンチマークと実践的なガイダンスをまとめたものです。 背景と主な仕様 W25Q64JVSSIQ 1 /CS 2 DO(IO1) 3 /WP(IO2) 4 GND 8 VCC 7 /HOLD(IO3) 6 CLK 5 DI(IO0) デバイス概要 — 主要パラメータ パラメータ値 容量64M-bit (8 MB) SPI モードSingle / Dual / Quad I/O 最大クロック最大 133MHz (Standard/Quad) ページサイズ256 バイト 消去サイズセクタ (4KB) / ブロック (32KB, 64KB) / チップ消去 標準 PGM/ERASEページプログラム 0.4ms、セクタ消去 45ms 低消費電力待機 1µA (typ)、ディープパワーダウン 1µA 電圧 / 温度2.7V ~ 3.6V / -40°C ~ +85°C パフォーマンスベンチマークと結果 シーケンシャルおよびランダム読み出し/書き込みの結果 測定されたスループットと SPI クロックの関係は、シングル I/O からクアッド I/O に移行した際に大幅な利得を示しています。理論上のクロックレートが高いにもかかわらず、ホストの DMA 制限やバス競合によって実際の利得が制限されることがよくあります。133MHz でのシーケンシャルクアッドリードは理論上 66MB/s に達しますが、実世界のオーバーヘッドにより、ホストコントローラの効率に応じて通常 45-50MB/s 程度に落ち着きます。 耐久性と消去動作 4KB の小さな消去セクタはウェアレベリングを簡素化しますが、メタデータのオーバーヘッドを増加させます。高信頼性のデータロギングを行う場合、エンジニアは標準 100,000 回のプログラム/消去サイクルの制限による影響を緩和するために、消去スケジューリングとオーバープロビジョニングを計画する必要があります。 統合および最適化ガイド ファームウェアとドライバの最適化 クアッドモードを有効にし、ダミークロックを最小限に抑えることは、測定されたスループットを引き出すために重要です。大規模なファームウェアのロード中に DMA 転送を使用すると、ホスト CPU の負荷が軽減されます。 // 疑似コード: クアッドモードとバーストリードの有効化 send(CMD_WRITE_ENABLE); send(CMD_ENTER_QUAD); // ステータスレジスタの QE ビットをセット send(CMD_FAST_READ_QUAD, addr, dummy_clocks); dma_transfer_read(buffer, length); 推奨事項とアクションチェックリスト 容量: 8MB がアクティブファームウェアと OTA アップデートスロットの両方を満たしているか確認してください。 スループット: ブート時間の目標を達成するために、ホスト SPI コントローラが Quad I/O をサポートしていることを確認してください。 レイテンシ: ファイルシステムドライバにおいて、45ms (typ) のセクタ消去時間を考慮してください。 電力: バッテリー駆動のアプリケーションでは、ディープパワーダウンモードを活用してください。 よくある質問 測定されたパフォーマンスベンチマークは、実際のブート時間にどのように反映されますか? ベンチマークは上限値を提供します。シーケンシャル MB/s はイメージのロード時間に直接影響し、ランダムリードはトランザクションのオーバーヘッドを増加させます。イメージサイズを維持スループットで割り、コマンドレイテンシを加算してブート時間を推定してください。 最高の耐久性を実現するプログラム/消去戦略は何ですか? ページ境界 (256 バイト) への書き込みをバッチ処理することで、消去頻度を最小限に抑えます。ライトコアレッシング(書き込み結合)を使用し、ファイルシステムロジックにウェアレベリングアルゴリズムを実装して、フラッシュアレイ全体にサイクルを均等に分散させてください。 高周波 SPI の信頼性に最も影響を与える基板レベルの実装は何ですか? レイアウトと電源の安定性が最も重要です。133MHz での信号整合性を確保するために、インピーダンス制御された短い配線を使用し、0.1µF のデカップリングコンデンサを VCC ピンにできるだけ近く配置してください。 W25Q64JVSSIQ で利用可能な省電力モードは何ですか? このデバイスは、標準のスタンバイモードと、超低電力のディープパワーダウンモード (通常 1µA) を備えています。これらのモードへの移行および解除には、特定の SPI コマンド (0xB9 および 0xAB) が必要です。
  • LMX4644TSH データシートの詳細解析:仕様、限界値、チャート

    Datasheet graphs and limits define the usable performance envelope for thermal behavior, current capability, and efficiency. This deep dive translates those figures into concrete design checks engineers can apply today using the LMX4644TSH datasheet. Product overview & quick spec snapshot What LMX4644TSH is and target applications The LMX4644TSH is a compact multi-output power stage intended for point-of-load regulation in high-density systems like telecom, compute rails, or FPGA supplies. Designers must align topology and thermal strategy with these specific application requirements. Parameter Value / Limit Unit Input Voltage (Vin) Range 4.5 to 16.0 V Max Continuous Current 4.0 (Per Channel) A Switching Frequency 200 to 1200 kHz Operating Junction Temp -40 to +125 °C LMX4644TSH VIN EN VOUT1 VOUT2 GND (Thermal Pad) Electrical limits: absolute max vs recommended operating Interpreting absolute maximum ratings Absolute maximums mark irreversible-damage boundaries. Treat these as avoidance zones and design clamping strategies so the board never approaches these spec limits under transient stress or fault conditions. Recommended operating conditions and derating Apply a rule-of-thumb derating: reserve 20% headroom for continuous operation and increase to 30–40% for high-temperature enclosures to ensure long-term reliability beyond the minimum datasheet specs. Performance charts decoded Efficiency & Thermal Response Efficiency vs load curves reveal where the device spends power. Use these curves to size upstream power and heat sinking. Thermal curves determine safe continuous currents; translate these into copper area and via count during the layout phase. Application examples & layout best practices For high-current single outputs, prioritize heavy copper and via arrays. For multi-output designs, balance shared input filtering and per-rail decoupling while checking cross-load transient specs in the LMX4644TSH documentation. Summary Reading the LMX4644TSH datasheet correctly turns charts into actionable design margins. Replicate core published charts in the lab, then iterate layout based on measured thermal behavior to converge on a validated design. Key summary Translate efficiency plots into board-level loss numbers for realistic thermal budget planning. Apply 20% derating to recommended operating values for reliable continuous operation. Reproduce datasheet test setups precisely—matching input filtering and probe placement. Frequently Asked Questions How do I use the LMX4644TSH datasheet to size thermal vias? Calculate required junction temperature delta, convert to needed thermal resistance, then determine via count and copper area per standard thermal conduction formulas provided in the thermal management section. What spec limits should I check first in the LMX4644TSH datasheet? Prioritize input voltage headroom, continuous output current, and thermal derating curves. Verify worst-case Vin and load current are within recommended conditions with derating applied. How can I reproduce LMX4644TSH datasheet results in my lab reliably? Build the recommended bench circuit, use Kelvin sensing, minimize probe ground loops, and use equivalent decoupling capacitors to avoid misinterpreting ringing or rise-time artifacts. What is the impact of switching frequency on LMX4644TSH efficiency? Higher frequencies reduce inductor size but increase switching losses. Consult the efficiency vs. frequency charts to find the optimal balance for your specific thermal and space constraints.
  • NL0333DCAE1S-ES データシートの詳細解説: 機能仕様とピンアサイン

    Low-voltage, rail-to-rail single-ended amplifiers are central to modern portable and sensor systems where headroom and power budget are constrained. This article delivers a practical, component-level walkthrough of the NL0333DCAE1S-ES datasheet so engineers can evaluate typical specs, interpret the pinout, and integrate the part into prototypes with confidence. (1) Component Overview & Key Use Cases The NL0333DCAE1S-ES is a low-voltage, rail-to-rail input/output operational amplifier suited for single-supply portable systems. Typical roles include sensor front-ends, battery-powered instrumentation, and compact audio preamps where headroom and quiescent current are critical. ParameterTypical Datasheet Value Supply Voltage Range1.8 V – 5.5 V (Single Supply) Input Common-Mode RangeRail-to-Rail (VSS-0.1 to VDD+0.1) Output SwingWithin 50mV of Rails (Light Load) Quiescent CurrentLow µA to sub-mA class Package TypeSOT-23-5 (2) Pinout & Packaging Details 1 OUT 2 V- 3 IN+ 5 V+ 4 IN- SOT-23-5 The standard SOT-23-5 configuration for the NL0333DCAE1S-ES provides a compact footprint. For PCB design, ensure the decoupling capacitor (0.1 µF) is placed within 2mm of Pin 5 (V+). Footprint accuracy is essential; follow standard IPC-7351 patterns for SOT-23-5 to ensure thermal and mechanical reliability. (3) Electrical Specifications Deep Dive DC characteristics: power, offsets, bias DC specs govern accuracy and battery drain. Input offset voltage (Vos) and drift directly affect ADC front-end accuracy. For example, a 100 µV offset at a 2.5 V full-scale input produces significant ppm error. Always check the NL0333DCAE1S-ES datasheet for the maximum quiescent current to calculate the worst-case battery life. AC characteristics: bandwidth, slew rate, noise AC parameters determine dynamic response. Slew rate indicates how the device handles fast edges, while input-referred noise determines SNR. For sensor sampling, prioritize bandwidth above the anti-aliasing corner to avoid signal distortion. (4) Typical Application Circuits & Design Guidelines Common circuits include unity-gain buffers and non-inverting amplifiers. Layout drives performance: route input traces short and shielded, and use ground pours. For capacitive loads, add a series output resistor (10–47 Ω) to prevent oscillation and ensure phase margin stability. (5) Troubleshooting & Integration Checklist Verify Pinout: Cross-check physical Pin 1 marking with the CAD library. DC Bias: Confirm the input signal stays within the common-mode range (VSS to VDD). Decoupling: Use low-ESR ceramic capacitors close to the supply pins. Thermal: Check junction temperature in enclosed or high-ambient environments. Key Summary Pinout clarity: Verify SOT-23-5 pin mapping and any EN or NC pins before PCB release. Critical specs: Confirm supply range (1.8-5.5V), input common-mode, and offset for ADC accuracy. Layout & testing: Place decoupling caps close to VCC and add output series resistance for capacitive loads. Frequently Asked Questions How do I confirm the NL0333DCAE1S-ES pinout on my PCB? Compare the package drawing in the official datasheet with your PCB land pattern; verify pin numbering orientation with a physical part or manufacturer mechanical drawing, and mark test pads for VCC, GND, IN+/IN−, and OUT. Which electrical characteristic most affects ADC front-end accuracy? Input offset voltage and drift have the largest direct effect on absolute accuracy; input bias current interacting with source impedance also introduces error. What quick bench tests reproduce datasheet conditions? Power the amplifier at the datasheet specified VCC, use the recommended load resistor, set gain per datasheet test circuits, and measure quiescent current, input offset, and output swing to rails. How to handle capacitive loads with NL0333DCAE1S-ES? Capacitive loads can induce instability in rail-to-rail amplifiers. Add a small series output resistor (typically 10–47 Ω) to isolate the load and maintain stability. End of Technical Analysis for NL0333DCAE1S-ES. For production-grade designs, always refer to the latest revision of the official manufacturer datasheet.